

What is Forex and How to Trade it - Best Beginner's Guide


 .
.Learn how to trade Forex with our ultimate and updated beginner's guide. Discover what are currency pairs, what is the spread, lots, pips in Forex, learn about money management, the mistakes to avoid, and much more!
Get insights from professional traders and learn all the basics that every beginner should know to successfully trade the currency exchange (FX) market.
Learn Forex Trading - Beginner's Guide
- Currency Pairs
- Basic Terminology
- Pips (price increments)
- Spread (transaction cost)
- Lots & Units (trade size)
- Leverage & Margin
- Money Management
- Candlestick Charts
- Technical Analysis
- Economic Calendars
- Trading Order Types
- Risks
- MetaTrader
- Best Time to Trade
- Practicing on a Demo Account
- Choosing the Best Forex Broker
What are Currency Pairs
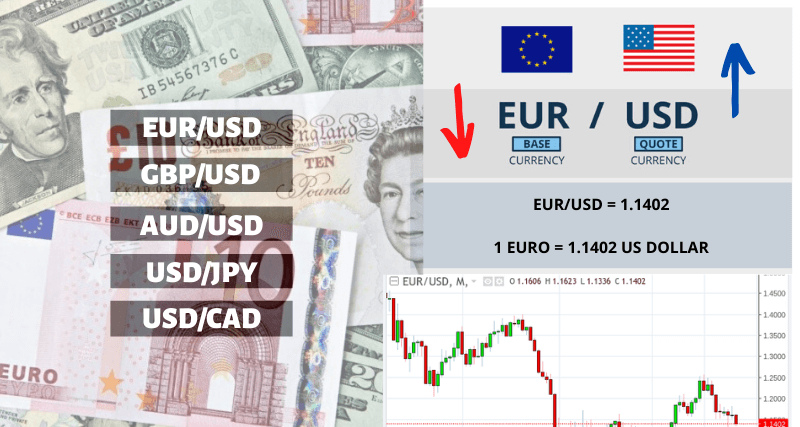
A currency pair is the pairing of two different currencies, such as Euro and the United States dollar, expressed like EUR/USD.
Traders buying the EUR/USD are speculating that the value of the Euro will increase relative to the US dollar. Traders selling the EUR/USD are speculating that the value of the US dollar will increase against the Euro.
What are Major, Minor and Exotic Currency Pairs
The Major currency pairs are the most-traded in the world, and the EUR/USD is the most popular of all.
The 7 major currency pairs are:
| Pair | Currencies | Nickname |
|---|---|---|
| EUR/USD | Euro (€) vs. US dollar ($) | Fiber |
| USD/JPY | US dollar ($) vs. Japanese yen (¥) | Gopher |
| GBP/USD | British pound (£) vs. US dollar ($) | Cable |
| USD/CHF | US dollar ($) vs. Swiss franc | Swissie |
| AUD/USD | Australian dollar (A$) vs. US dollar ($) | Aussie |
| USD/CAD | US dollar ($) vs. Canadian dollar (C$) | Loonie |
| NZD/USD | New Zealand dollar (NZ$) vs. US dollar ($) | Kiwi |
Minor currency pairs are less popular than the major currency pairs and do not include the US dollar (USD). Examples of the minor pairs are the EUR/CHF and GBP/JPY. Minor currency pairs are quite liquid but less so than majors.
Exotic currency pairs include the currency of an emerging economy country such as USD/RUB (Russian Ruble) or USD/MXN (Mexican Peso). The exotic pairs are more volatile and less liquid than minors resulting in a higher transaction cost.
Market Terminology
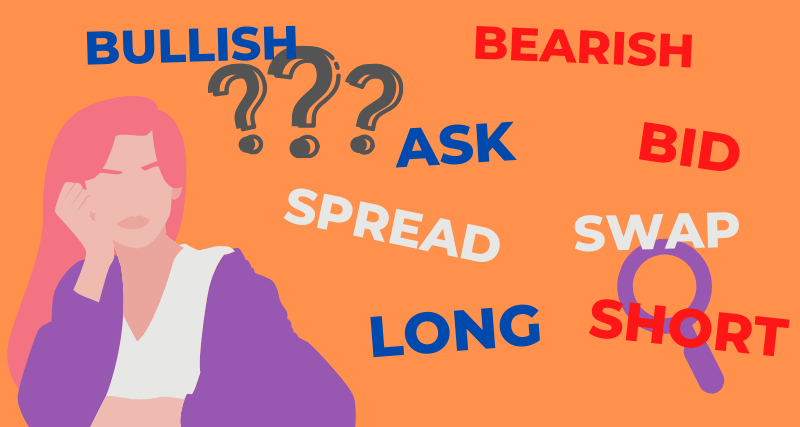
Let’s look at the most important forex terms:
Ask and Bid Prices - The Ask price is the price an instrument can be bought at, and the Bid price is the price an instrument can be sold at. The Ask price is always higher than the Bid price, so initially every trade starts at a loss.
Spread in forex is the difference between the Ask and the Bid prices. This price difference is where the banks, brokers and dealers make their profits, in addition to commissions charged, if any.
Swap rate or rollover rate, is the interest added or deducted for keeping a currency position open overnight. The negative or positive swap rate is calculated based on whether the position is a buy or sell and is based on the interest rate differential for each currency.
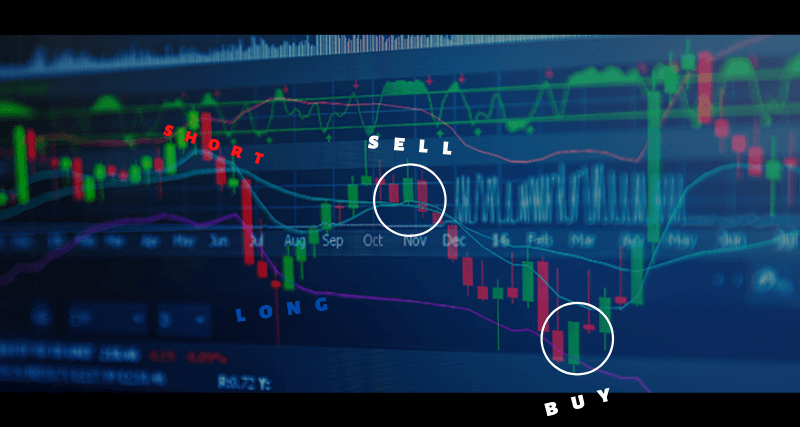
Short & Long positions refer to selling or buying. When you sell you are entering a short position. When you buy you are entering a long position.
Bear & Bull market refers to whether the market trend is convincingly up or down. In a bear market prices are falling whereas in a bull market prices are rising.
CFD is short for Contract for Difference. These products enable traders to make a profit or loss based on the difference between the entry and exit prices of a trade, without taking ownership of the underlying assets. CFD's are popular in forex, stocks, indices and commodities.
What are Pips (price increments)
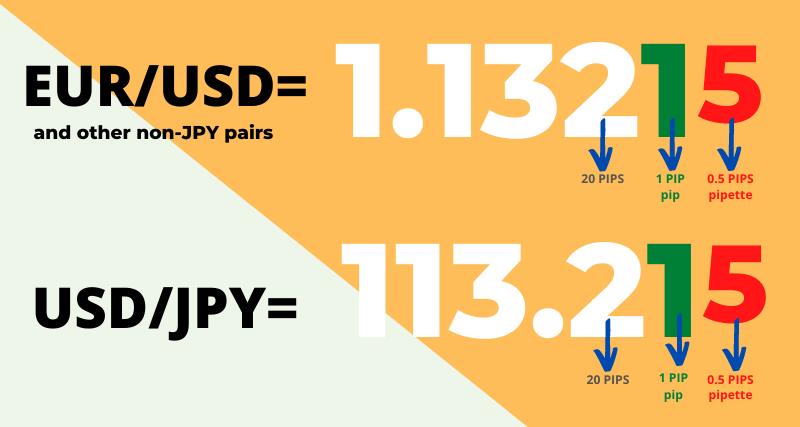
A Pip in forex means the smallest price change a currency pair can make, except for fractions of a pip or 'pipettes'.
For most currency pairs 1 pip is 0.0001; for currency pairs with the Japanese Yen such as USD/JPY 1 pip is 0.01. When trading metals, 1 pip for Gold and Silver is 0.01.
When the EUR/USD moves up from 1.0925 to 1.0926, the change is 1 pip. With 5-digit pricing, if the EUR/USD moves up from 1.09255 to 1.09260, the move would be half a pip.
Pip values vary by currency pair, use our calculator to easily calculate pip values.
What is the Spread (transaction cost)
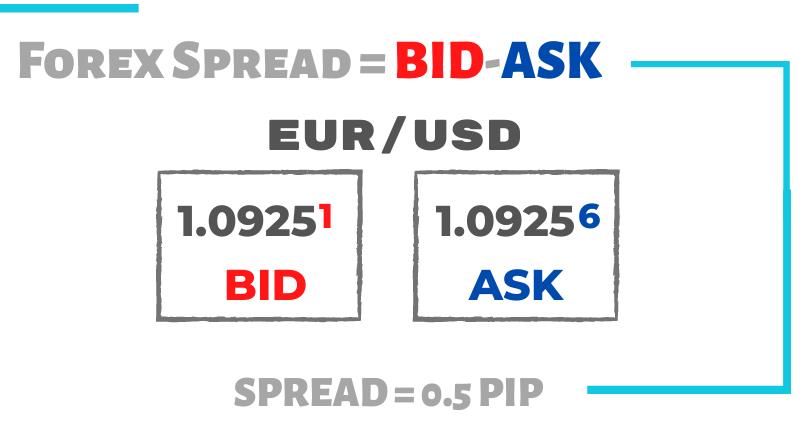
The spread of a financial instrument (stocks, forex, etc.), refers to the price difference between the Ask price and the Bid price. Spread is a type of transaction cost, along with commissions, if any. Due to the spread, each trade will start off at a loss, because you buy at the ask price and sell at the bid price.
EUR/USD spread example:
| Bid Price | Ask Price | Spread | |
|---|---|---|---|
| 4-digit quote | 1.0928 | 1.0929 | 0.0001 = 1 Pip |
| 5-digit quote | 1.09252 | 1.09257 | 0.00005 = 0.5 Pips |
What are Lots (trade size)
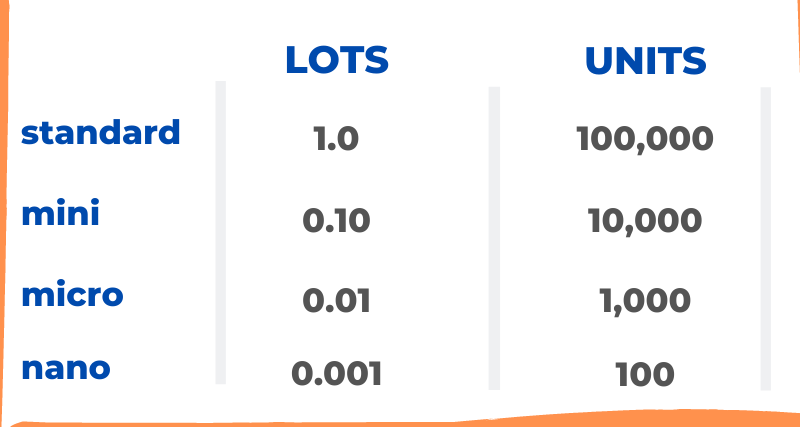
In forex a Lot defines the trade size, or the number of currency units to be bought or sold in a trade. One Standard Lot is 100,000 units of the base currency.
Most brokers allow trading with fractional lot sizes down to .01 or even less. Fractional lot sizes are sometimes referred to as mini lots, micro lots and nano lots. Please refer to the picture above to compare the sizes and units.
What is Leverage & Margin
Leverage allows a trader to control a larger position using less money (margin) and therefore greatly amplifies both profits and losses. Leveraged trading is also called margin trading.
Leverage will amplify potential profits and losses. For example, buying the EUR/USD at 1.0000 with no leverage, to take a total loss the price must go to zero, or to 2.0000 to double your investment. If you trade using the full 100:1 leverage, a price movement of 100 times less will produce the same profit or loss.
Margin is the capital a trader must put up to open a new position. It is not a fee or cost and is freed up again once the trade is closed. Its purpose is to protect the broker from losses. When losses cause a trader's margin to fall below a pre-defined stop out percentage, one or all open positions are automatically closed by the broker. A margin call warning from the broker may or may not precede such a liquidation.
How Does Leverage Work
With 100:1 leverage a trader can open a position 100 times greater than they could without leverage. For example, if the cost to purchase .01 lots of EUR/USD is normally $1000 and the broker offers 100:1 leverage, then the trader must put up only $10 as margin. Of course, the trader can use as little leverage as they want.
Beware: Higher leverage means higher risk. Most professionals use a very low leverage ratio, or none at all, and a modest risk percentage per trade.
For more on leverage check out our article What is Leverage in Forex and How to Use It.
To calculate margin requirements based on trade size and leverage use our handy Forex Margin Calculator.
What is Money Management
Money management is a set of rules that will help protect your capital and ultimately, assist you in growing your trading account.
The most important rule is to risk only a small fraction of your account at one time. By doing so you will be able to withstand the inevitable losing streaks. As a rule of thumb, many traders believe in risking 2%, or less, per trade.
What is Drawdown
Drawdown is the reduction of capital from an equity high to a subsequent low, typically expressed as a percentage. Maximal drawdown refers to the greatest historical drawdown an account suffered through.
What are Candlesticks Charts
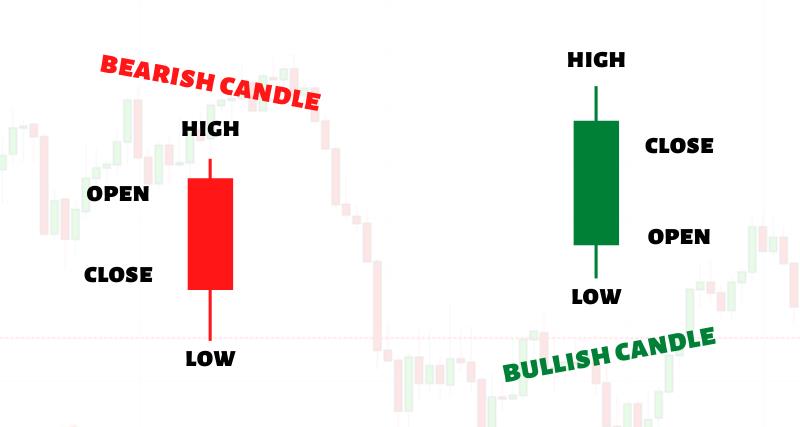
A candlestick bar is comprised of the body and lower and upper wick, representing the Open, High, Low, and Close (OHLC) prices during a specified period from 1 minute to 1 month.
If the price traveled down and closed lower the candlestick is coloured red; if the price traveled up and closed higher it's coloured green.
To see candlestick charts in action, check our Free Forex Charts.
For more on candlestick patterns check our complete article Forex Candlestick Patterns: The Complete Guide.
What is Technical Analysis
Technical Analysis is the study of price action to determine whether to buy or sell an asset and at what price.
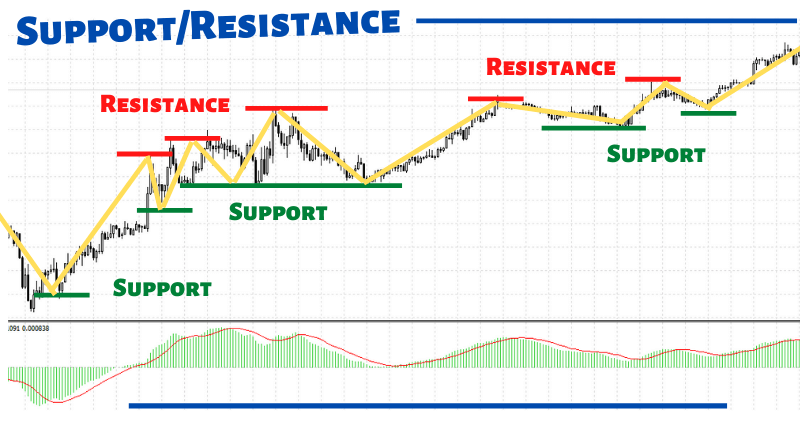
It is performed straight on an asset’s price chart, with the aid of technical indicators like RSI or MACD, or with other tools like support/resistance, Fibonacci retracements, or with combinations.
Successful traders testify "the trend is your friend" and "don't try to ride a horse in the opposite direction that it's going". You will have better success trading with the longer-term trend and staying away from markets with no clear trend.
When an analyst identifies a trend, the next step is to try to identify how far that trend might go or when it might be exhausted to assess if it represents a trading opportunity. The idea is to buy at the lowest price on an uptrend and sell it at the highest price, or vice-versa on a downtrend.
Trends are made of pulses and retracements in a zig-zag shape which are also called support and resistance levels. The support level is the price where traders are willing to buy an asset, while the resistance level is the price they are willing to sell. Older levels are more powerful than newer ones and once a level is breached, it can invert so that an old support level becomes a new resistance level and vice-versa.
What is Multi-timeframe Analysis
Technical analysis should always be viewed from multiple timeframes, from a monthly chart (where each candlestick represents one month) down to 1 hour. Higher timeframe charts like weekly and monthly can confirm a major trend while lower timeframe charts like daily and 4 hours can help identify the best entry opportunity.
Economic Calendar Data and Volatility
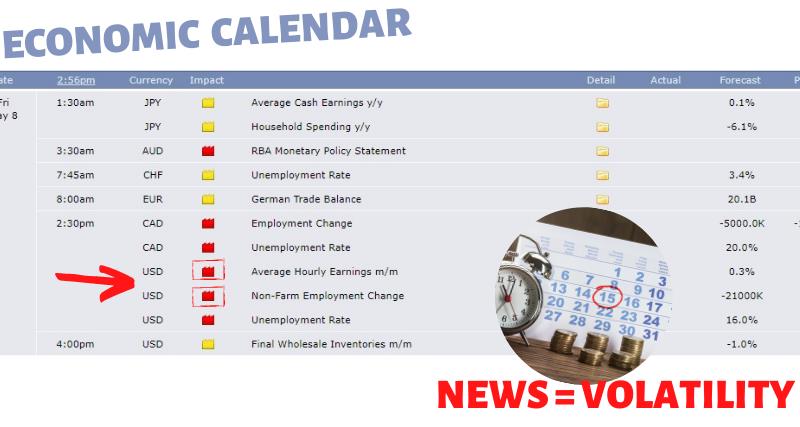
Governments and other sectors around the world are constantly measuring and reporting on economic growth and data, and a reliable economic calendar is one of a trader's top tools.
The volatility created on a currency pair like the EUR/USD after key employment data like US Non-farm payrolls is announced can create big moves and price gaps. If prices gap 50 pips for example, it means within that 50-pip range there is no liquidity and you cannot exit a trade or enter a new one for the moment.
Having trades open during major economic or geopolitical news announcements can be risky. High volatility can occur within seconds of such news events.
Prior to the release of economic data, analysts try to forecast the results and a consensus estimate is formed. If the data is very important and the reported value is significantly different than estimates, high volatility can ensue.
Learn How to Use the Economic Calendar
At the beginning of each trading week, be sure to check the economic calendar for upcoming high and medium impact events using the impact icon next to the event name. High impact events use a red icon while medium impact events use an orange icon.
The "Impact" value on the calendar represents the potential for that report to impact the market. If the data released in an economic report is significantly different than what was forecast or expected, then the impact may be realized. Otherwise if the data is in line with expectations, the report may have little or no impact.
Traders typically check the upcoming economic events on the calendar for one of 2 reasons. The first is to avoid having open trades during potentially high volatility. The second is to use that volatility to look for nice entry and exit points on new or existing trades.
On most forex economic calendars, you will see the important values below.
Previous Month Value - Shows the results of the previous month, which may change because sometimes the prior month is adjusted. This surprise may cause volatility.
Forecast or Consensus Value - Shows the forecast based on a consensus of economic analysts.
Actual Value - Shows the actual report value and may cause volatility if it differs significantly from the forecast.
Impact - The magnitude of potential impact for a report is denoted with a coloured icon next to the event name. Red means high impact and orange means medium impact.
Check out our Economic Calendar frequently to ensure you are always aware of high and medium impact upcoming events.
Trading Order Types Available in Forex
Market Orders are orders to buy or sell immediately at the next available price. Market orders are fast; however, the next available price could be quite different than the current price a trader is viewing, especially during volatile times. This is known as slippage. Placing market orders during volatility or illiquidity can result in high slippage.
Limit Orders are orders to buy or sell that are limited to a specified price or better. Unlike market orders they offer full control over execution price. Of course, if the order price is not available at the time of execution the order goes unfilled.
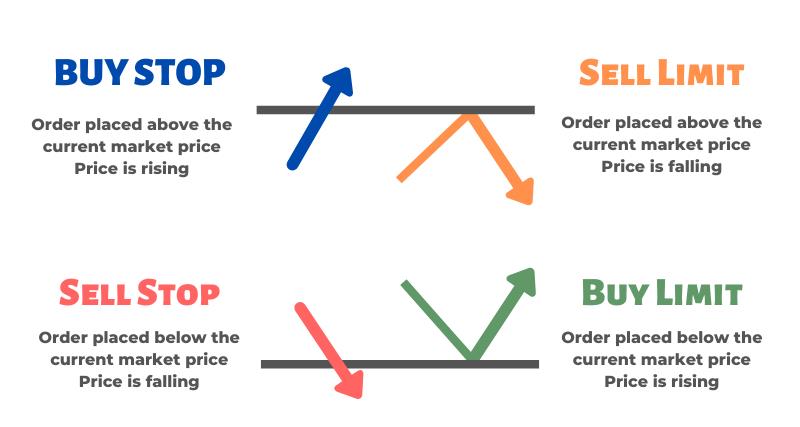
What are the Different Types of Pending Orders
Pending orders are set to execute in the future when price hits a certain level. They can set with an expiration date, or good until cancelled (GTC). Some are executed as limit orders and some as market orders depending on the type.
Take-Profit is a pending limit order to close a trade once a profitable trade reaches a set price.
Trailing-Stop is a pending order to close a trade a certain number of pips away from the highest price reached.
Stop-Loss is a pending market order to close a trade at the next available price once a losing trade reaches a set price.
Buy-Stop is a pending market order placed above the current price to buy once the price rises above it.
Sell-Stop is a pending market order placed below the current price to sell once the price falls below it.
Buy-Limit is a pending limit order placed below the current price to buy once the price falls to it.
Sell-Limit is a pending limit order placed above the current price to sell once the price rises to it.
Stop-Limit orders function like the stop orders described only they execute as limit orders.
What are the Risks in Forex Trading
The biggest risk to any new trader is trading without adequate knowledge and experience and frequently results in big losses.
Using high leverage to take huge trades can cause a trading account to quickly go to zero, or even negative if the broker doesn't offer negative balance protection.
Also, a broker could go out of business and you could lose your investment if there is no deposit insurance provided by the broker's regulator.
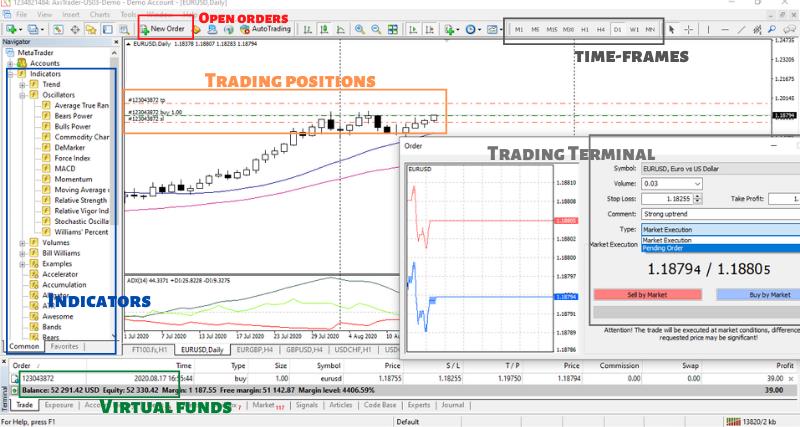
What is the MetaTrader Trading Platform
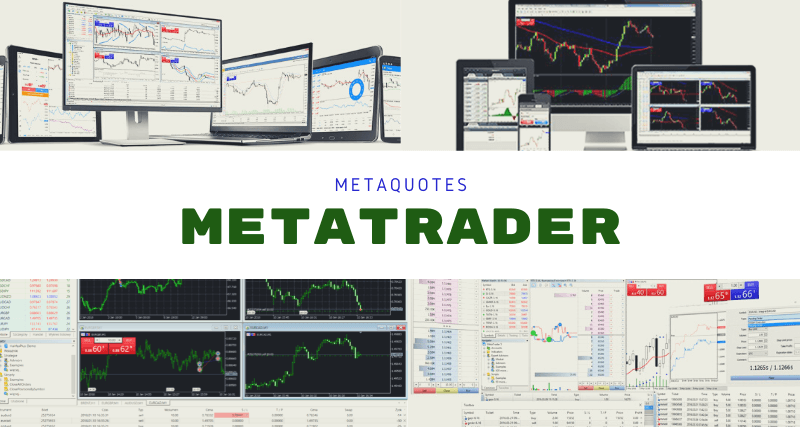
MetaTrader is the most popular third-party forex trading platform and is offered by the majority of the brokers. Complete with charts and several technical indicators built in, it allows users an easy way for trading forex and, depending on the broker, also CFDs on shares and indexes, commodities and cryptocurrencies.
Automated trading robots (EAs) called 'Expert Advisors', technical indicators and scripts can be easily built in the MQL language editor using a simple programming language similar to C++. Expert Advisors can even be backtested on historical price data using the built-in strategy tester.
Many of these add-ons are available free for download or for purchase at various websites.
What is the Best Time of Day to Trade Forex
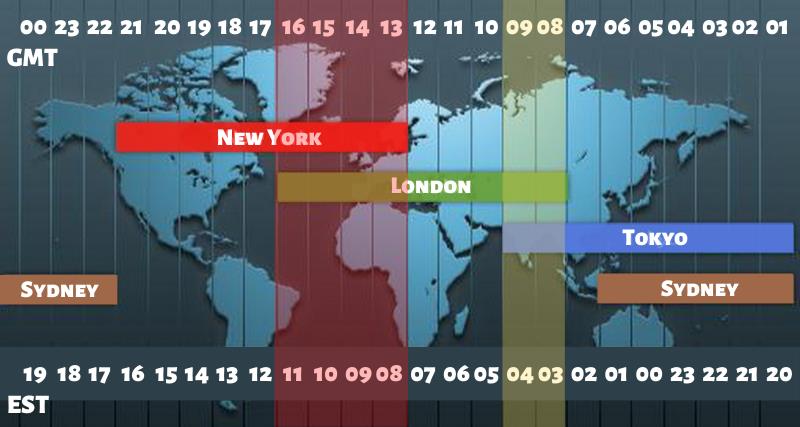
The 24-hour global forex market can be roughly grouped into 4 trading sessions, corresponding to the hours that major financial hubs conduct business and report on economic data.
- North America - New York, USA
- Asia - Tokyo, Japan
- Asia-Pacific - Sydney, Australia
- Europe - London, UK
During the periods of highest trading volume, fast-moving prices are more likely to create opportunities, while spreads are also at their lowest.
The most active trading period is usually the 4 hours overlap of London and New York between 8:00 - 12:00 New York time, generally regarded as the best time to trade forex. Sydney and Tokyo also overlap between 24:00-6:00 GMT.
If you would like to know more about the best and worst times to trade, check out our article What is the Best Time to Trade Forex.
How to Open a Forex Demo Account and Start Practicing
A demo trading account lets you practice trading without the risk of losing real money. It's the best place for beginners to learn the basics, like how to use the trading platform, proper position sizing etc. The emotions that accompany real money trading differ from practice trading, so once a beginner graduates to real money trading they should still proceed with caution.
To open a demo account and begin practice trading immediately, check the table below for links to a few of the most popular brokers globally.
| Broker | Countries Available | Open an account |
|---|---|---|
 IC Markets | Most, except USA | Free demo account Live account |
 XM | Most, except USA | Free demo account Live account |
 IG USA | USA | Free demo account Live account |
How to Choose the Best Forex Broker
There are a few big factors to consider when choosing a new forex broker. These include regulation & deposit insurance, pricing, execution, and customer service.
Check out our Forex Brokers List Page and use the filter to find the best broker for you based on virtually any criteria including regulation, deposit insurance, negative balance protection, leverage, pricing, user rating, cent accounts, etc. You can also live chat or email us for additional assistance.
The following additional articles may also be of help, when choosing the best broker:
- Best Forex Brokers in 2020: With Customer's Reviews
- Best Forex Brokers in the USA
- How to Find the Best Forex Broker: 7 Key Factors to Consider
Final Consideration
Professional forex traders are very disciplined people, who regularly trade with pre-defined risk and money management rules. Even though the FX market can present an opportunity to earn an income, you should go slowly and gain the necessary experience. Be disciplined and seek independent financial advisors where necessary.
 Copy Link
 Share on Facebook
 Share on X
 Share by Email