

How to Identify and Profit from the Most Popular Forex Chart Patterns

The technical analysis term "price pattern" indicates a graphic representation that follows a predefined price pattern, on an asset's chart, easy to visualise and to predict.
It’s the technical analysis technique used by analysts to recognize the formation of some price patterns and consequently try to predict the future evolution of the asset's price. The technical analysis patterns can be found by carefully observing an asset's price action and its evolution on the chart.
Technical Analysis Patterns
What are these patterns? According to the principles of technical analysis there are different types of price patterns. But we will analyse the three most popular Forex chart patterns used to trade price trends breakouts and reversals. Learn in this article how to identify and profit from these chart patterns.
For purely educational purposes, following the trading signals generated by these price patterns can yield good results using a real trading strategy. In fact, these technical analysis patterns can be so accurate that it is possible to enter the market with a well-defined plan and make a profit.
Let's start analysing the 3 most common technical analysis patterns.
Head and Shoulders Pattern
Probably the most known and popular price pattern in the world. The head and shoulders pattern takes its name from the particular shape made by a security’s price on a chart, similar to a human’s top part of the body.
And here’s an example of a head and shoulders pattern that can indicate a trend reversal (or a price correction):
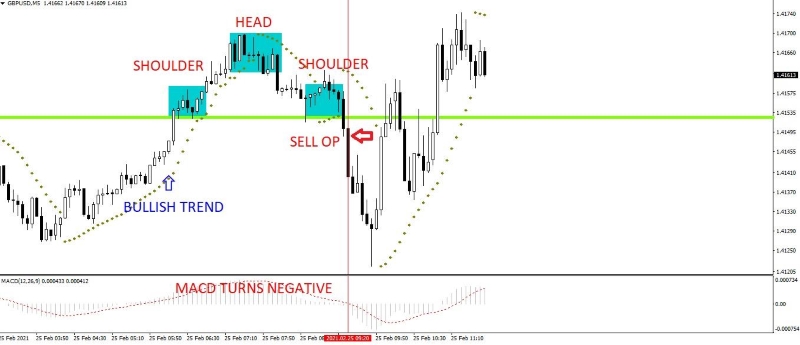
Let's analyse the head and shoulders pattern in more detail. Here is how it can be identified on a price chart:
- A first rising high and a small retracement down, within a bullish trend (left shoulder)
- A further push of the trend to a maximum point (head)
- A decreasing high and a small retracement up, always in a bullish trend (right shoulder)
To confirm the head and shoulders pattern we need to identify the so-called neckline, that is, the point that will confirm the effective formation of this price pattern.
In other words, if the price closes below this level then it will be possible to be in the effective presence of the head and shoulders pattern that will indicate a trend reversal.
What if the price does not close under the neckline? If the price is closing firmly above the neckline, it will be more appropriate to look at the pattern as a continuation of the bullish trend.
The head and shoulders pattern will also be voided if the price breaks through the maximum point (head). The second relevant occurrence in the head and shoulders price pattern is the possible pullback. The pullback indicates a very common price move in this pattern, which is the test of the price level just broken.
Therefore, there might be the good probability, once there will be a break of the neckline level, the price might rise to test the neckline level. The following descent will give us the confirmation that the head and shoulders pattern is actually formed.
Being a reversal pattern, we specify that this pattern is only found in presence of a well-defined bullish trend. Moreover, this pattern is also widely used by traders as after this reversal price pattern the price tends to moves in a clear and defined way, with possible excellent profit margins.
How to spot and trade the head and shoulders price reversal pattern
The head and shoulders pattern is a very common one, found across different securities, not just Forex, and always forming on several time-frames, even on Monthly!
A head and shoulders pattern appearing on a bullish trend can indicate an imminent trend reversal, as buyers are exhausting and bears might take control of the price action.
Looking at the price chart, and following a bullish trend, try to spot where price is stopping and retracing. Then you should see a second push upwards, normally double the length of the retracement, followed by a decline to same level of the previous push upwards.
To complete the pattern formation, and to make the second shoulder, a new push upwards should happen to about half of the decline, followed by a new decline to previous level.
- A bullish trend is in progress
- Formation of the left shoulder with a high, retracement and further push to a new high
- Price stops and after a few bars, comes down (head)
- Formation of the right shoulder with a low, retracement and further low
- Price breaks below the neckline level
- Wait for the pullback to the neckline level (on volatile trends it might not happen)
- Enter a sell order at market price
An inverted head and shoulders pattern appearing on a bearish trend can also indicate an imminent trend reversal, as sellers are losing interest on the market and bulls might take control of the price action.
The principle and concept of the inverted head and shoulders pattern is similar to the previous one, only the shape will be inverted.
Double Top Pattern
This price pattern is slightly easier to identify compared to the head and shoulders pattern, because, as the term itself says it needs two maximum price points to be identified. Also, in this case, there is the opposite pattern called double bottom, based on the same key structure, only inverted.
And here’s an example of a double top pattern that can indicate a trend reversal (or a price correction):
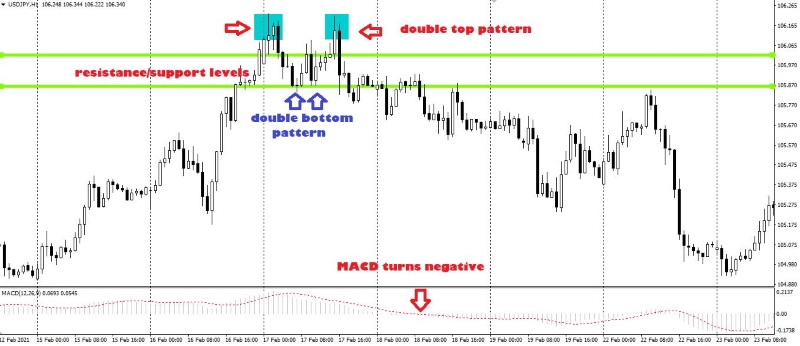
Unlike the head and shoulders pattern there isn’t a maximum and a decreasing point. Instead, on the double top pattern (or double bottom), is made of two equal maximum points (or two equal minimum points in case of the inverted double bottom) quite similar to each other. Also, in this pattern, we can identify a support/resistance zone, represented in the chart by the green lines.
To successfully trade the double top pattern, or the double bottom pattern, it will be equally important to verify the actual strength of the resistance/support level, perhaps with the aid of an oscillator, like the MACD, to confirm the double tops or the double bottoms, and a trend retracement.
Probably, also in this case there will be a pullback to the resistance/support zone with the price going to test the zone itself before gaining strength from more sellers/buyers and begin a strong downtrend/uptrend.
How to spot and trade a double top (double bottom) price reversal pattern
It might be hard to the untrained eye to spot a double top or a double bottom pattern, especially if the chart is zoomed in. We recommend to have your candlestick price chart zoomed at an intermediate level to include several bars.
The easiest way to spot the double top pattern is to look for candlestick bar formations that resemble an “M”. To spot an emerging double bottom pattern, use the same approach, but instead look for candlestick bar formations that resemble a “W”.
- A bullish trend is in progress (downtrend for the double bottom)
- Formation of the first high (low), retracement and further high (low) to the same price level, followed by another retracement
- Wait for the break of the last support/resistance level
- Wait for the pullback to the broken support/resistance level (on volatile trends it might not happen)
- Enter a sell/buy order at market price
Triple Top Pattern
The triple top pattern is similar to the double top price pattern, except it has an extra “leg”. This price pattern can be found both in uptrends and downtrends (triple bottom). In the triple top pattern, we will not find two high points (or low), but three.
And here’s an example of a triple top pattern that can indicate a trend reversal (or a price correction) with a similar structure to the double top pattern:
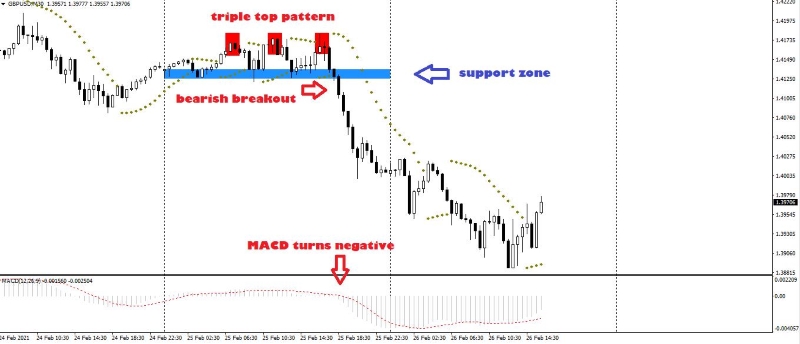
The triple top pattern (or triple bottom), is made of three equal maximum points (or three equal low points in case of the inverted triple bottom) quite similar to each other. Also, in this pattern, we can identify a support/resistance zone, represented in the chart by the blue rectangle.
To successfully trade the triple top pattern, or the triple bottom pattern, it will be equally important to verify the actual strength of the resistance/support level, perhaps by using the MACD, to confirm a trend retracement.
Probably, also with this pattern, the market might react with a pullback to the resistance/support zone, testing the zone itself before gaining strength from more sellers/buyers and begin a strong downtrend/uptrend.
How to spot and trade a triple top (triple bottom) price reversal pattern
As before, we recommend to have your price chart zoomed at an intermediate level to include several bars. The easiest way to spot the triple top pattern is to look for candlestick bar formations that resemble an “M”. This would indicate the presence of a double top pattern. If the double top pattern holds and instead of going down, goes up again and then, with an extra leg down, could indicate the presence of a triple top pattern.
To spot an emerging triple bottom pattern, use the same approach, as explained before. Look for candlestick bar formations that resemble a “VW” formation.
- A bullish trend is in progress (downtrend for the triple bottom)
- Formation of the first high (low), retracement and further high (low) to the same price level, followed by another retracement and another high and a final retracement
- Wait for the break of the last support/resistance level
- Wait for the pullback to the broken support/resistance level (on volatile trends it might not happen)
- Enter a sell/buy order at market price
Forex Chart Patterns: Trend Indicators
As it often happens in trading, there is no trend indicator or oscillator better than the others or able to always provide profitable signals. The secret is to combine one or two indicators with the chart patterns in order to have a confirmation or signal, to enter a long or sell position with a good chance of profit.
Below, you will find the best indicators, in our opinion, that can be used in combination with technical analysis and Forex chart patterns. Let's find out more about them.
The Support and Resistance Levels
This trend indicator is fundamental to trade the markets, as they are levels created by past price action, where the price tends to congest and consequently stop and reverse, or breakout and continue on the trend direction.
The most immediate meaning is given by the fact that a security’s price moves within channels defined by resistance levels, key levels above the current price, and support levels, key levels below the current market price.
Near these levels, the price slows down and traders will have to figure out if the market will have the strength to break that level or not.
Very often, a resistance coincides with the highest point where the price stops to form a double top pattern, for example, or a head and shoulders. Support and resistance levels are useful to anticipate the formation of a price pattern and helpful to correctly positioning a trade.
The RSI Oscillator – Relative Strength Index
The RSI oscillator is used by thousands of traders because of two fundamental aspects that it offers, its ease of reading and its excellent reliability.
This indicator can tell us if a security’s price is currently trading in an overbought or an oversold zone. In the first case, too many investors have entered in the market with a long position, therefore a retracement can be imminent.
In the second case, the exact opposite will occur, too many investors entered the market with a sell positions and a correction might happen. How to read the values of the RSI?
The RSI Oscillator ranges from 0 to 100, with values from 70 to 100 indicating that the market is currently overbought. Values between 30 and 0 indicate that the market is currently oversold.
The intermediate values, used in combination with the chart patterns, do not offer significant cues. But the use of the RSI can be a powerful tool when looking for price patterns because it tells us if the pattern that is forming is a consequence of an overbought or oversold market, that the trend is exhausting, and that a reversal can happen.
The MACD Oscillator – Moving Average Convergence Divergence
One of the oldest and most used oscillators, the MACD is a price oscillator based on the crossing of three moving averages and able to offer reliable cues for trading.
The MACD is also an important price oscillator, even used by professional traders. In order to confirm a price pattern, and a possible trend continuation or reversal, the MACD can be very useful.
Trend indicators and oscillators can be of great help to filter bad signals or to confirm the possibility of a successful trade, but the key variable is the ability of the trader to filter wisely the signals deriving from these indicators.
To help filter the signals generated by chart price patterns, in the next paragraph we will make a clear summary of what you should consider before opening a short or a long trade:
- Choose a trading platform where all the indicators are available
- Draw on the chart the support and resistance levels
- Wait for the Forex pair chart pattern to form and identify where the pattern is forming, on a resistance level, for example
- With the price closing below (or above) the neckline, or the support/resistance level, check the RSI or the MACD for further confirmation
- Enter the market with a corresponding sell or buy
Conclusion
In order to get the best outcome of this strategy, it is necessary to practice and train your eyes to spot these patterns when they start forming.
To do this, we recommend you to open a demo account with a reputable broker and download the trading platform where you practise with virtual funds with zero risk. We can also recommend a visit to our Forex, commodities and crypto currencies live charts page where you can find candlestick bar price charts with the most popular instruments.
With time, you will be familiar with the price action, learn to draw accurate support and resistance levels and learn to read the values of the trend indicators and price oscillators like the RSI and MACD.
If you would like to discuss the contents of this article, or to make any suggestions, please use the comments section below.

John Lee Rossi, currently head of fundamental and technical research with Clear Markets Ltd., is a seasoned trader with more than 16 years experience trading in the financial markets. John previously worked for several brokerage companies, operating in different OTC markets, specialising in a wide range of financial products, from Forex trading to commodities trading. Happily married to his lovely wife Frances, John has two teenage daughters. Away from the business, he enjoys hiking, golfing, and spending time at the Ozarks lake with family and friends.
 Link kopieren
 Auf Facebook teilen
 Auf X teilen
 Per E-Mail teilen